All storytelling is powerful – stories are the stuff of our lives, they surround us and provide meaning and purpose. But in an increasingly information-saturated world, the visual storyteller has the ability to cut through the noise and be remembered. The history of media consumption is one where the primacy of the visuals has always been instinctively understood. Technological development follows suit, so screens in cinemas and the domestic environment get bigger, images get richer, and it is not by accident that the introduction of the web browser and enough bandwidth to support images (and later video) was what made the internet a genuinely mass-market proposition.
Humans are primarily visually driven creatures. University of Rochester researchers have discovered that more than 50 per cent of the cortex, the surface area of the brain, is devoted to processing visual information. Though we are nowadays interacting with digital and increasingly virtual spaces, we are doing so with senses that evolved over millions of years to keep us safe. Our acute eyesight and the importance our brain puts on processing visual data is part of that – when our eyes are open, a full 2 billion of the 3 billion neurons firing every second, deal with visual information. We already know that we process visual information quicker than that received by any other sense. Though the frequently quoted figure of processing images 60,000x faster than text has been roundly debunked as marketing flimflam, the fact remains that we can correctly identify images seen for as little as 13 milliseconds. Crucially, we also retain that information better.
Examination of what is known as the Picture Superiority Effect shows that our memory improves markedly with increasing visual stimuli. One study concluded that after three hours the ability to recall information from a spoken lecture was 25 per cent, rising to 72 per cent for reading the same information, and 80% for visual and verbal material (participatory learning involving role plays etc. took this all the way up to 90%). There are some things we remember better than others – the most easily remembered object in a photo, rather charmingly, is another human face.
There are multiple theories that try to explain this. A commonly understood one, the Dual Coding Theory, posits that pictures are stored twice in the brain, once as an image and once as a verbal record, making them easier to retrieve. Either way, the Picture Superiority Effect explains why, when you look at metrics concerning modern media, the data for engagement with visual material is so impressive. Simply put, people remember pictures better and they remember them longer.
This is reflected in social media. We have known that graphics have an important effect on social media engagement for some time now. In 2014, Twitter analysed its already substantial datasets and concluded that the inclusion of photo material in tweets boosted retweets by 35 per cent and overall engagement by 3x. Video, meanwhile, led to a 28 per cent boost, and it is likely that this value has risen since then as video content has become more prevalent in high bandwidth environments. In a similar vein, in 2015 Buzzsumo concluded that images added to Facebook posts led to 2.3x more engagement. And when you look into demographic data, an interesting trend emerges; a recent study found that images influence millennials (33%) more than Generation Xers (21%) and baby boomers (12%). Appealing to a younger audience is crucial to commercial success, so it was no idle whim that saw Facebook buy the then 13-employee strong Instagram for $1 billion in 2012.
Silent pictures
A decade on, Instagram generated an estimated $47.6 billion revenue in 2021, accounting for almost 50 per cent of Facebook’s total revenue, and it is interesting to note where we currently are in the accelerating journey towards more visual content. In an increasingly noisy reality, audiences are starting to rely solely on their visual sense more to consume media that was originally created with both audio and visual components. Up to 85 per cent of people watch Facebook videos with the sound off, meaning that the visual element has to convey more information than ever.
Automated subtitles have historically been one way of ensuring this happens, but transcription errors have tended to be at the mercy of a plethora of screen sizes and aspect ratios, making their effectiveness hit or miss.
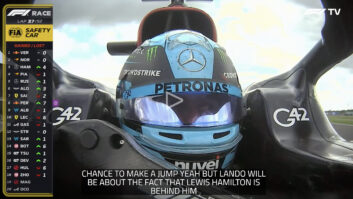
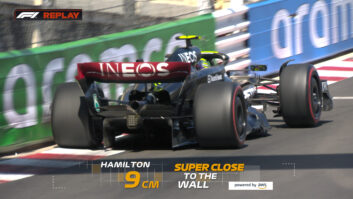
After all, if the consumption of media ends up so stripped-back that only the visual remains, there is a real danger that it becomes impossible to understand the meaning of what we are seeing, thus robbing the story of any value whatsoever. That means producers need to add something, and that something is broadcast graphics. And once you add a tool as powerful as that to your process, the path is short between conveying information and enhancing it.
In 2018, the National Basketball Association (NBA) in the USA pioneered a workflow that saw it rapidly capture, log, and tag video which was then passed on to editors sitting on top of different social media channels. At this stage in the process, Vizrt’s Viz Libero sports analysis tool was used to provide a layer of graphics, the idea being that the graphics would compress the time it took to convey information and analysis about the video clip to the viewer and increase engagement as a result.
Fifteen clips per day were published across each platform. 3D graphics were — and still very much are — used to highlight key moments, deconstruct elements of individual plays, or provide a better understanding of a team’s strategy. Player and team statistics were inserted into dynamically moving graphics, substantiating and enriching the analysis clips.
It is worth quoting Steve Hellmuth, EVP operations and technology, NBA, talking about the impact of the process on the NBA’s reach: “Any time people see video that includes graphics, analytics, includes some insight along with a great story and a great series of plays – that’s what attracts them. That’s what takes it from 200,000 hits to two million, right out of the box.”
Competition for eyeballs
Media consumption is continuously growing and fragmenting, and once it fragments (not to say atomizes) into a plethora of platforms, these are not stable but ever changing. While the pandemic saw viewing in the media rich landscape of the UK during lockdown rise up to 6 hours and 25 minutes per day; these hours are increasingly fragmented the younger the audience. Streaming services are the obvious contender, but so are the broadcaster’s own on-demand apps and ad-driven platforms like YouTube.
The point is that, for broadcasters worldwide the competitive environment is increasing and the number of screens and formats they must support are also growing. Content has to work across platforms and across borders, often in diverse languages, and it has to make an impact with increasing rapidity before the viewer scrolls on by, clicks away or zaps. In an eyeball economy, it makes sense to play on humanity’s predilection for the visual – enhancing visuals so that they help stimulate engagement, boost recall, and convey information in a concise manner. This will ensure that viewers a) continue to consume content, b) remember where it they found it, and c) return.