Anyone who watches sport regularly knows the importance of graphics to hep tell the story of what’s happening on screen.
Whether it’s the amount of possession in a football match, how many first serves a player has hit in a tennis match, or a live leaderboard during a golf tournament, graphics help viewers understand what’s happening as they watch.
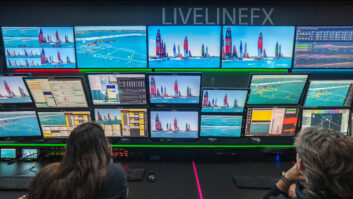
TVBEurope speaks to Verso Live’s managing director Jeff Clark about the company’s work on delivering graphics for major sporting events, including last month’s Ryder Cup.
What are the latest areas of innovation for live broadcast graphics?
There are several strands of new capabilities coming to broadcast graphics. In sports, real-time data has always been key, and now that’s being pushed further with predictive statistics; we’re not just seeing what a player has done, we’re seeing the percentage chance of what they might do. This predictive element adds another layer of engagement for audiences, as it provides deeper insights into player and team performance and outcomes. This data enhances the overall experience by allowing viewers to appreciate the game at a more analytical and strategic level.
Other areas of innovation focus on the way that data is presented and visualised on screen. A total graphics solution offers numerous options, not only in terms of dynamic onscreen design, but also how and where that information is inserted into the programme. Remote and cloud production of graphics continues to expand the possibilities for broadcasters, enabling them to streamline operations with effective utilisation of resources and deliver high-quality, engaging content to viewers from anywhere.
What were the real-time graphic presentation requirements during your recent Ryder Cup project?
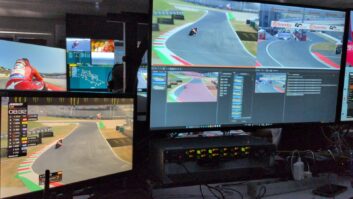
A pertinent requirement for the Ryder Cup was the addition of new “always on” graphics and how they then respond to other graphics transitioning on and off the screen. Whilst many sports feature a consistent score and clock that is always on-screen, the Ryder Cup had specific requirements. For golf, the thinking is closer to Formula 1 – where an audience always needs to know the driver’s position. But with golf there is an additional layer of complexity across 18 holes of simultaneous play.
Covering 18 fields of play rather than a single pitch presents a unique challenge. Our data and control systems for onscreen graphics must match the coverage, this means shots that are several minutes old need to be tracked and inserted into the programme. Viewers remain none-the-wiser, as a combination of the bottom-right leaderboard, the top-left player, and a shot ident graphic link together, to provide context for the state of play at all times.
Are integration needs changing in broadcast workflows? And how does the implementation of technology like Unreal Engine enhance workflow optimisation?
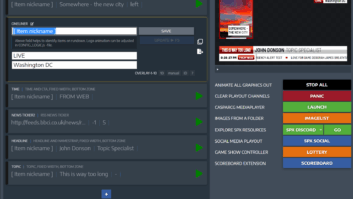
We’re seeing a more hands-off approach to broadcast workflows, especially with the introduction of remote and cloud production and virtual machines. The demand to run systems and configure things over APIs, rather than with literal users interacting with the software on a given machine is growing.
Unreal Engine doesn’t fit into most broadcast workflows off-the-shelf. We have to remember that it was made, and still is developed, as a game engine first. A lot of the work we do with Unreal Engine leverages its capabilities and wraps those up so it is compatible with the broadcast workflows that most production and graphic designers are used to.
Sport fans expectations are changing, what trends are you seeing around the ways viewers like to receive match information and statistics?
With sports fans consuming content in so many different ways, and across multiple platforms, the casual viewer must be taken into consideration. We have to accept that the casual viewer is likely to dip in and out of content or watch short sections of the final program. Therefore, the graphics and information onscreen need to tell a story for viewers at different levels of engagement, without the expectation that they’ve been following every minute from the start. This also plays into making onscreen information easier to digest, which can be as simple as featuring the right design and fonts, through to how we carefully word complex stats and present them in a bitesize format.
What are some of the new requirements for distribution of graphic outputs and integrating real-time data?
We’re now required to be far more flexible with our equipment and outputs. In some hybrid production situations, we need low-latency remote previews that might be done over NDI but still have HD-SDI Fill/KEY outputs to production because the machine is installed with the desk in a studio.
Latency is also key when integrating new predictive probability statistics. When working with this sort of data as we did with Capgemini at the Ryder Cup, individual shots can swing the outcome. We need to visualise the data related to key moments of play as quickly as possible before the probability is affected by something else.
How did the process and coordination between graphics operators and production teams work in the context of the Ryder Cup?
The matchplay format of the Ryder Cup adds extra pressure to the graphics operation. Unlike in strokeplay, in matchplay, players concede shots and pick up on the green, and whether a single hole is won or lost has a huge impact on the story.
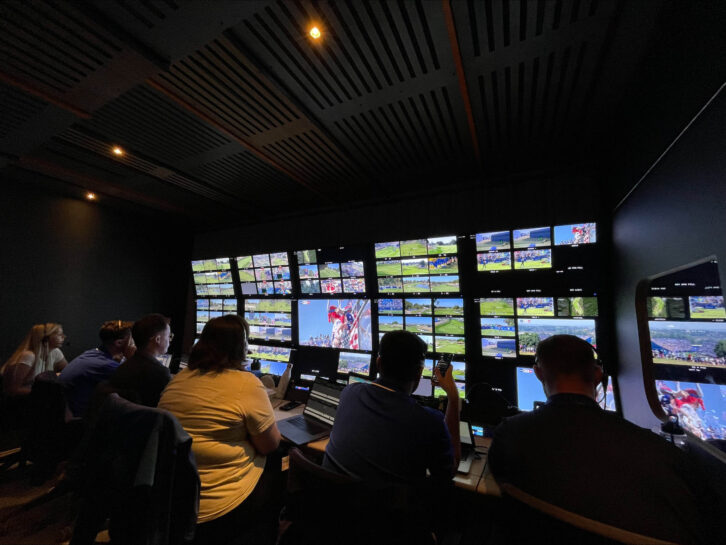
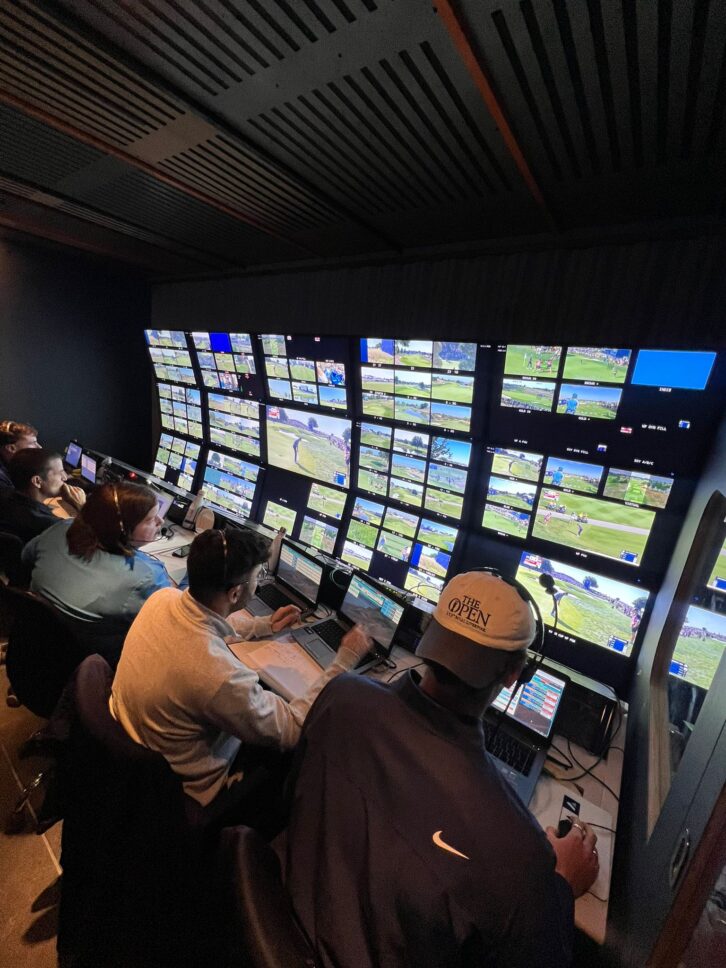
For the Ryder Cup, the graphics row consisted of two production staff communicating on radios to spotters, two graphics operators, and a graphics producer relaying information to the main production. The graphics row has access to all scoring information, culminating in consolidated data from official scoring data feeds, shot-by-shot feeds and our own data entry.
The two graphics operators are split between looking after the top left shot ident, which is needed for every single shot, and the bottom right leaderboard. Both roles are in constant communication, following the coverage with a datafeed system which shows which data they can accept into their graphics and what they may want to hold back if it has not been shown live yet.