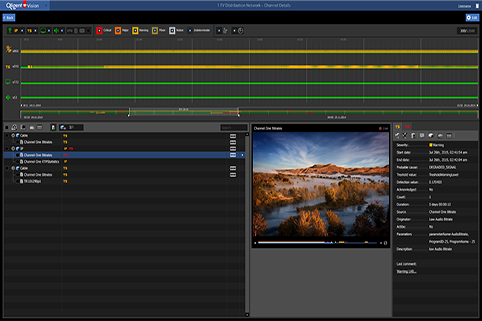
A multichannel visualisation application has been debuted that offers a new way to monitor the health and status of many channels on a single screen.
Q’ligent’s application is part of its flagship Vision platform and extends the depth of the company’s multisite monitoring and analysis capability. Vision is Q’ligent’s enterprise-level system for monitoring broadcast and media quality through the entire delivery chain. It can be deployed on-premises, in the cloud or via Q’ligent’s Oversight managed monitoring-as-a-service (MaaS) plan.
Q’ligent claimed its approach to multichannel visualisation is unique as it helps engineers diagnose problems through a simple three-step workflow. Using customised video widgets (vidgets), users can combine any monitoring parameters to quickly visualise performance issues that matter most to the user, determine impact on the viewer and drill down to the root of the problem.
This manner of correlating a variety of data with quality and performance issues allows operators to quickly filter, sort and collect evidence across multiple channels, programs and their associated terrestrial, cable, satellite and IPTV delivery platforms.
Beyond offering an overall status view, the new multichannel visualisation application crosses Q’ligent’s two major monitoring dimensions: Quality of Experience (QoE) and Quality of Service (QoS). The QoE dimension provides visualisation of all audio and video streams, giving users clear insight into current and historic performance of all channels across each delivery platform.
The QoS dimension allows users to objectively measure transport and physical layers to ensure standards are being met – legally, contractually and performance-wise. Correlating and analysing data across both QoE and QoS dimensions quickly determines if the problem can be seen by a consumer, said the company.
Stand 8.A09